

In order to study the influence of the rolling and forging process on the microstructures, the tensile, impact toughness, and hardness of Sanmac 2205 three different diameter solid bars for each process were investigated. The rolled and forged bars were produced by Alleima Tube AB. The results showed that the average ferrite content for the rolled and the forged specimens were virtually the same. Additionally, the tensile results for the rolled specimens were higher than those after forging. However, variations in the tensile properties for the rolled versus forged specimens were very small. Moreover, Rockwell hardness values for the specimens after rolling were slightly higher than those after forging.
By Dr Munir Al-Saadi, R&D Senior Engineer, Alleima Tube AB (formerly Sandvik Materials Technology), Sandviken, Sweden
Introduction
Sanmac 2205 is widely used in production flow lines for extracting oil and gas from sour wells, in refineries and in process solutions contaminated with chlorides[1]. It has shown enhanced mechanical and corrosion properties, making it an attractive and economical choice for various applications. Sanmac 2205 bar is mainly produced by EAF melting, AOD process, LF Refining, Continuous Casting (CC), Hot-rolling, Solution Annealing, Straightening, and Peeling to a final rolled-bar diameter. However, there is interest in producing material by forging.
Compared with forging, rolling is the more beneficial process. It is several times higher in productivity and 1.5 times higher in dimensional precision, thus lowering material loss during peeling and after final rolling. As the total cost of rolling is lower than forging, replacing forging with rolling for Sanmac 2205 is desirable to reduce the cost of production.
Rolling and forging are both high-temperature compressed deformation processes. However, there are significant differences in equipment shape and movement, deformation zone geometry and metal flow pattern. Therefore, the type of hot working process might have an effect on microstructure isotropy and impact strength. In the present work, the CC blooms in the form of 365×265 mm are processed with rolling and forging to manufacture solid bars of three different diameters (Ø140, Ø160, and Ø180 mm) per each process.
| Condition | Heat No. | Lot No. | Final Diameter | C | Si | Mn | P | S | Cr | Ni | Mo | N |
| ASTM A 182 Grade F51 (UNS S21803) | 0.030 max | 1.00 max | 2.00 max | 0.030 max | 0.020 max | 21.0 – 23.0 | 4.5 – 6.5 | 2.5 – 3.5 | 0.14 – 0.20 | |||
| Rolled Bar | 538239 | 60992 | Ø140 | 0.019 | 0.40 | 0.80 | 0.026 | 0.0029 | 22.42 | 5.41 | 3.07 | 0.174 |
| 538986 | 78101 | Ø160 | 0.016 | 0.56 | 0.74 | 0.023 | 0.0040 | 22.26 | 5.44 | 3.13 | 0.173 | |
| 78121 | Ø180 | |||||||||||
| Forged bar | 539872 | 04541 | Ø140 | 0.016 | 0.40 | 0.84 | 0.021 | 0.011 | 22.36 | 5.41 | 3.08 | 0.171 |
| 04561 | Ø160 | |||||||||||
| 04581 | Ø180 |
Table 1. Chemical composition, wt. %
Experimental procedure and material processing
The chemical composition of the rolled and forged bar used in this study is shown in Table 1, along with the chemical requirement of ASTM A182 grade 51 (UNS S31803) for reference. Transverse and longitudinal samples for microstructural test, tensile testing, and impact testing were extracted from a location at half radius and at a distance approximately 2½ times the outer diameter of a bar (~ 500 mm) from a heat-treated end surface.
The microstructural samples were machined, prepared, and etched for examination using a Light Optic Microscope (LOM). Etchant 13a and Etchant 220 according to ASTM E407 [5] were used. Austenite spacing was measured on longitudinal samples using specification DNV-RP-F112 [6]. Furthermore, the ferrite content of each test specimen and location were measured using a ferritscope at half-radius of the bar.
Tensile tests were made at room temperature according to ASTM A370 [7] and performed on a set of three specimens for each location and direction. In addition, the tensile equipment was used according to ASTM E8/E8M-13a and conformed to Practice ASTM E4. Impact toughness tests were made at a temperature of ~-50 °C and the impact machine was used according to ASTM 2298-13a. The impact specimen was Charpy-V notch, 10×10 mm, according to ASTM A370-13 and ASTM E23-12. Impact testing for each location and orientation was performed on a set of three specimens. The disc was taken transverse to the bar length and divided into four quarters. Hence, the hardness tests were made at room temperature by using Rockwell C-Scale Tester according to ASTM A370 and method per ASTM E18 at each quarter with 5 mm intervals for every position {0°, 120°, 240°, and 360°}.
| Ø140 | Ø160 | Ø180 |
 |
 |
 |
 |
 |
 |
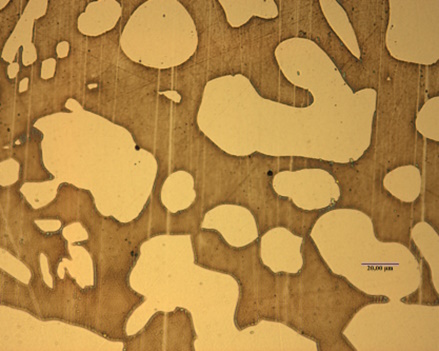
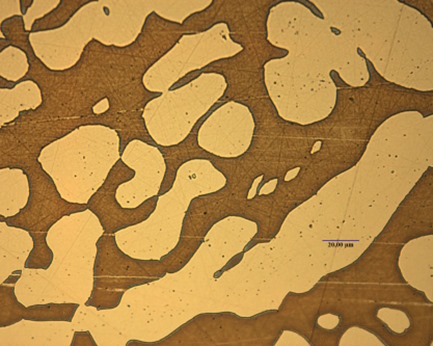
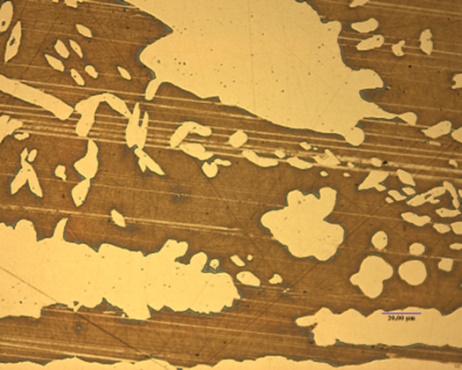
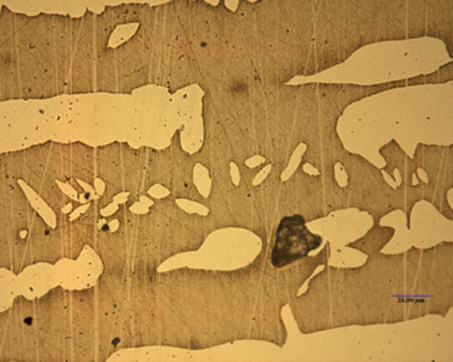
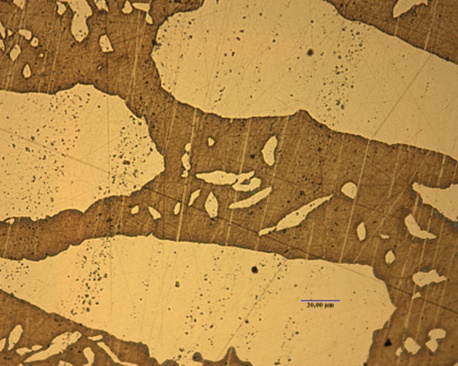
Figure 1. Microstructures at transverse direction. On the upper: As-rolled, on the lower: As-forged. 400x magnifications before reproduction.
| Ø140 | Ø160 | Ø180 |
 |
 |
 |
 |
 |
 |
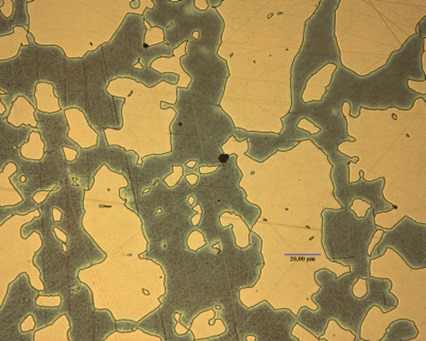
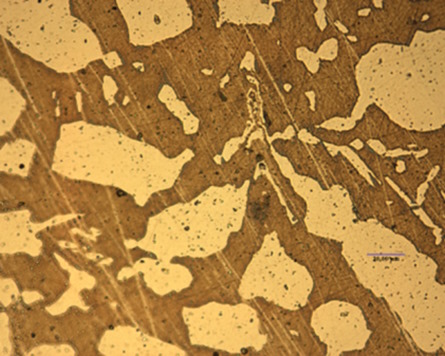
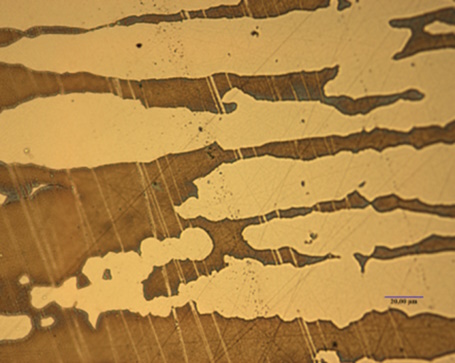
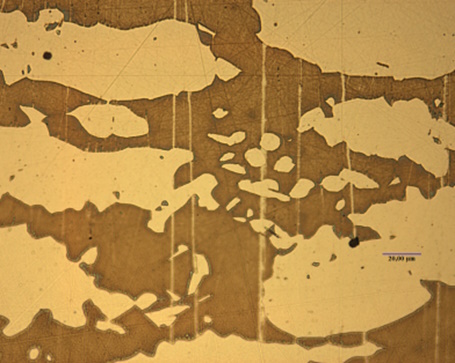
Figure 2. Microstructures at longitudinal direction. On the upper: As-rolled, on the lower: As-forged. 400x magnifications before reproduction.
Results and discussions
Microstructure – The results of the etched transverse and longitudinal microstructure for the half radius of a final diameter and correlative forged bar exhibited in Figure 1 and Figure 2. Figures 1 and 2 show the austenite phase in bright and the ferrite phase in darker contrast. In the transverse direction, the shape of austenite in the forged bar is somewhat more elongated and serrated grain than in the rolled bar. Moreover, there is a large quantity of secondary austenite phases in the forged bar. The anisotropic microstructure of the rolled versus forged bar in the transverse section is somewhat high, but low in a longitudinal direction. Furthermore, the microstructure is free from continuous networks of Cr2N precipitates.
Average austenite spacing and ferrite content of forged and rolled bar – The average austenite spacing values with standard deviation “s” obtained and ferrite content for the half radius of the longitudinal microstructure were listed in Table 2.
The average austenite spacing values for the rolled specimen are lower for all rolled specimens with low scatter (below ±0.06 μm), as shown in Table 2. The average ferrite content of Ø140 and Ø180 bar produced by the rolling process is slightly higher than that of the forged one with low scatter (below ±0.03). However, the average ferrite content of the Ø160 forged bar is somewhat higher than the one produced by the forging process.
| Route | Rolling | Forging | ||
| Diameter [mm] | Austenite spacing, [μm] ±s | Ferrite content, [%] | Austenite spacing, [μm] ±s | Ferrite content, [%] |
| Ø140 | 29.61±0.04 | 51.9±0.01 | 43.7±0.04 | 47.4±0.02 |
| Ø160 | 32.01±0.06 | 50.3±0.01 | 42.8±0.08 | 51.3±0.0 |
| Ø180 | 30.81±0.05 | 49.9±0.01 | 42.5±0.05 | 47.3±0.03 |
Table 2. Average austenite spacing values and ferrite content by different hot-working process
Tensile properties – The tensile results of the transverse (T) and longitudinal (L) directions in two different processes were listed in Table 3.
As shown in Table 3, the yield and ultimate strength results for the rolled specimen of each final diameter in the longitudinal direction are somewhat high and similar for all rolled specimens. In addition, the variation in the yield strength for the rolled versus forged specimen in the longitudinal direction are relatively small, though greater in the final diameter Ø140. For the diameters Ø160 and Ø180 mm, there were no big differences in yield strength between rolled and forged bar in the longitudinal direction. Besides, the variation in the ultimate tensile strength for the rolled and forged specimens is very small, though greater in the final diameter Ø160 and Ø180 mm and the same as in the diameter Ø140. Furthermore, the yield strength results of the rolled specimens of each final diameter in the transverse direction are similar for all rolled Ø140 and Ø160 specimens, but in the rolled diameter Ø180 mm is slightly lower. However, the ultimate tensile strength of the rolled specimen in the transverse direction is rather similar to the forged specimen. Furthermore, the variation in the tensile strength for the rolled versus forged bar in the transverse direction are very small, though somewhat greater in the final diameter Ø160. It is worth noting that no or very small variation in the tensile strength is observed between the longitudinal and transverse directions. As shown in Table 3, the elongation results in the rolled specimens of each final diameter are very close in the longitudinal and transverse direction and also similar to forged bar.
| Diameter [mm] |
Position | Yield strength, min, [MPa] |
Ultimate strength, min, [MPa] |
Elongation, min, % | Yield strength, min, [MPa] |
Ultimate strength, min, [MPa] |
Elongation, min, % |
| Rolling | Forging | ||||||
| Ø140 | L | 535 | 727 | 42 | 475 | 721 | 43 |
| T | 505 | 736 | 36 | 496 | 737 | 38 | |
| Ø160 | L | 502 | 723 | 39 | 472 | 705 | 41 |
| T | 504 | 740 | 36 | 471 | 712 | 40 | |
| Ø180 | L | 512 | 727 | 40 | 485 | 707 | 40 |
| T | 495 | 724 | 34 | 501 | 723 | 37 | |
Table 3. Tensile properties of rolled and forged bars
Impact toughness – Results of the impact toughness testing of rolled versus forged bars in the longitudinal and in the transverse direction were shown in Table 4.
The toughness average and single values for the rolled specimens of each final diameter in the longitudinal direction are greater than the forged specimens and similar for all rolled specimens. In addition, the toughness results for the rolled specimens in the transverse direction are somewhat greater than the forged specimens and similar for all rolled specimens. It is worth noting that the variation in the average impact toughness values for the rolled versus forged specimens in both directions is significantly higher, though somewhat greater in the final diameter of Ø180 mm.
| Diameter [mm] | Position | Rolling | Forging | ||
| Average value [J] | Single minimum value [J] | Average value [J] | Single minimum value [J] | ||
| Ø140 | L | 276 | 213 | 208 | 162 |
| T | 153 | 131 | 119 | 95 | |
| Ø160 | L | 297 | 237 | 199 | 164 |
| T | 143 | 107 | 109 | 87 | |
| Ø180 | L | 308 | 263 | 137 | 127 |
| T | 160 | 142 | 96 | 83 | |
Table 4. Comparison of rolled and forged bar material in Charpy V-notch Impact Toughness
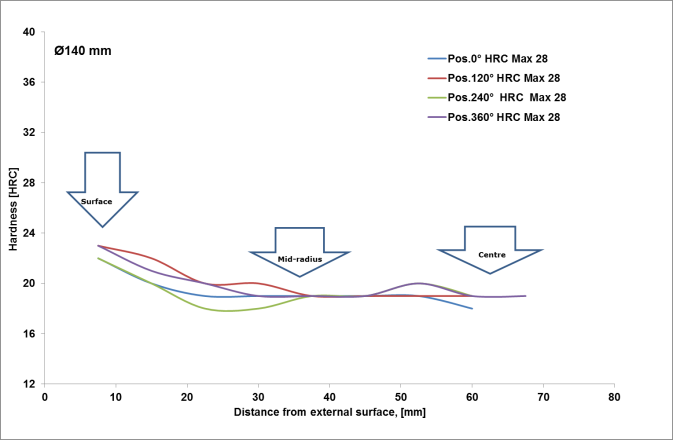
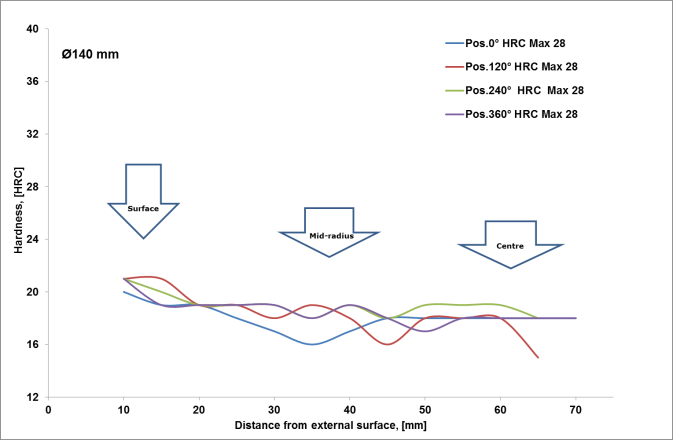
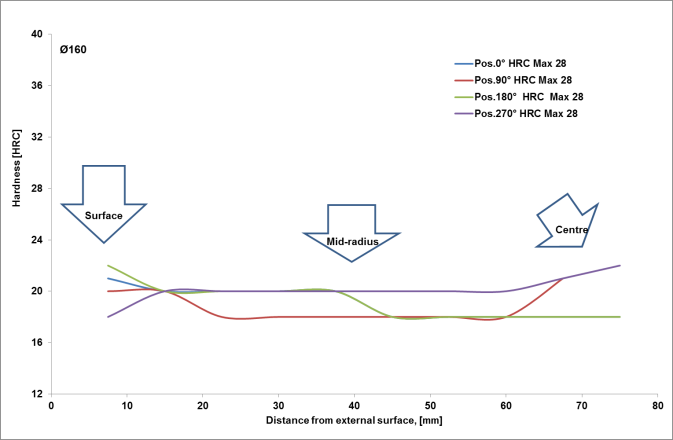
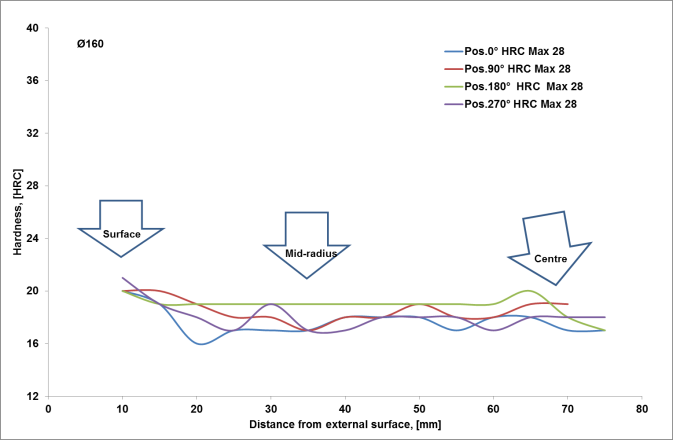
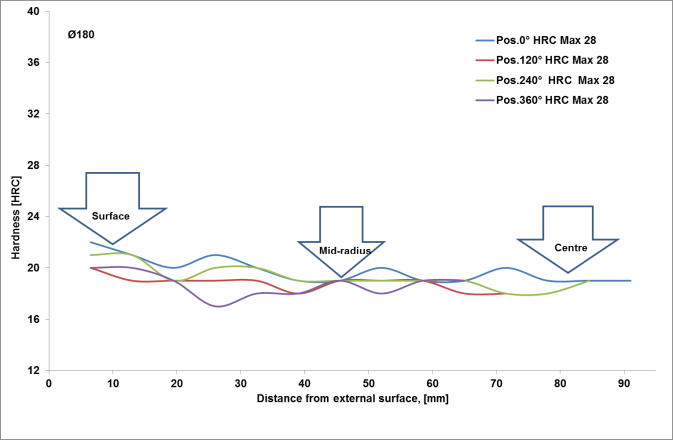
Hardness – The results of hardness testing of an as-rolled and as-forged bar are shown in Figure 3. In general, hardness values of the rolled and forged bar material are lower than material property requirements, are given only for guidance and for internal requirements, the upper limit is a maximum of 28HRC.
The hardness results for the rolled specimen from the external surface to centre of a final diameter Ø140, Ø160, and Ø180 are virtually the same as the forged specimen, though some hardness values obtained in the forged performed at the right angles are slightly different and somewhat less but still within specification.
This is particularly at the mid-radius and centre. It is worth noting that the variation in the hardness values for the rolled specimen is slightly low relative to the forged specimen.
| Production route | |
| Rolling | Forging |
 |
 |
 |
 |
 |
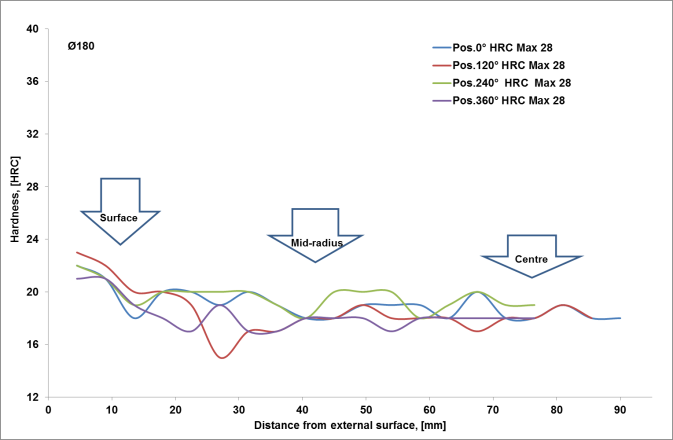 |
Figure 3. Hardness vs. distance from the external surface. Left column = rolled bar, right column = forged bar.
Conclusions
Conclusions can be drawn as follows:
- The shape of austenite in the forged bar shows somewhat more serrated grains relative to the rolled bar.
- A large quantity of secondary austenite precipitates showed more in the forged bar.
- The average austenite spacing values for the rolled bar are small, in the range of 29-32 μm and for the forged material in the range of 42-43 μm.
- The tensile results for the rolled bars are somewhat higher than the forged ones.
- The toughness results of the rolled bars in the longitudinal and transverse directions are greater than the forged bars.
- Hardness values for the rolled and forged bars are virtually the same and lower than material property requirements.
References
- https://www.alleima.com/en/technical-center/material-datasheets/bar-and-hollowbar/bar/sanmac-2205/
- ASTM A479-14, Standard Specification for Stainless Steel Bars and Shapes for Use in Boilers and Other Pressure Vessels
- ASTM A276-15, Standard Specification for Stainless Steel Bars and Shapes
- ASTM A182-14a, Standard Specification for Forged or Rolled Alloy and Stainless Steel Pipe Flanges, Forged Fittings, and Valves and Parts for High-Temperature Service
- ASTM E 381ASTM E407, Standard Practice for Microetching Metals and Alloys
- Recommended Practice DNV-RP-F112, October 2008
- ASTM A370, Standard Test Methods and Definitions for Mechanical Testing of Steel Products

About the author
Dr Munir Al-Saadi has worked for Alleima (formerly Sandvik Materials Technology) in Sandviken, Sweden, since 2007 as a development engineer in R&D Metallurgy, focusing on re-melted material for medical applications, super-duplex and nickel alloys for oil & gas applications. Today, he is R&D Senior Engineer in the Tube, Metallurgy and Product Development department.
About this Tech Article
Appearing in the September 2024 issue of Stainless Steel World Magazine, this technical article is just one of many insightful articles we publish. Subscribe today to receive 10 issues a year, available monthly in print and digital formats. – SUBSCRIPTIONS TO OUR DIGITAL VERSION ARE NOW FREE.
Every week we share a new technical articles with our Stainless Steel community. Join us and let’s share your technical articles on Stainless Steel World online and in print.